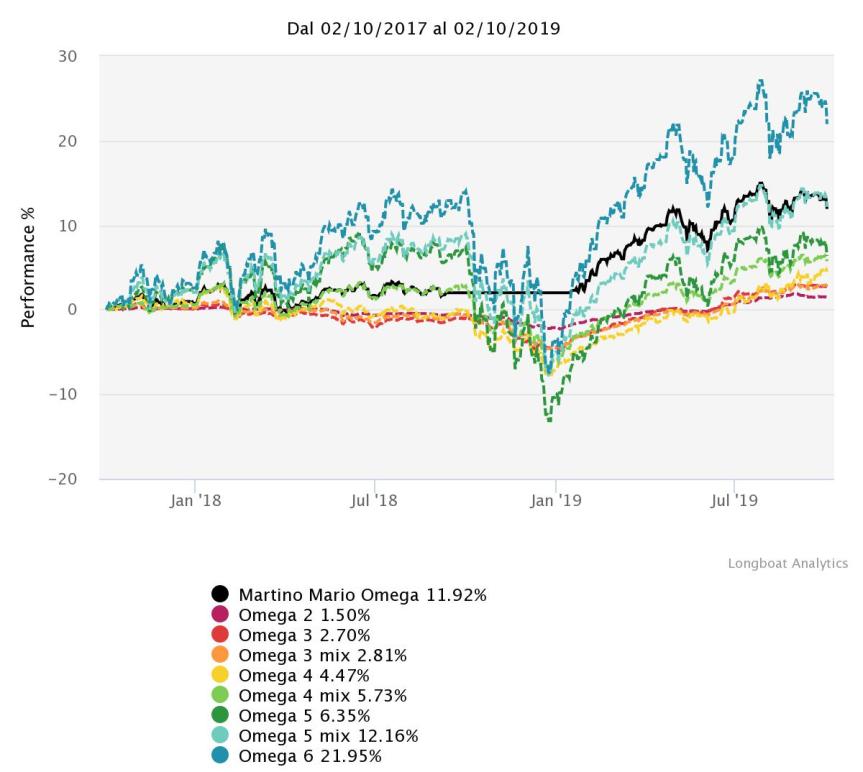
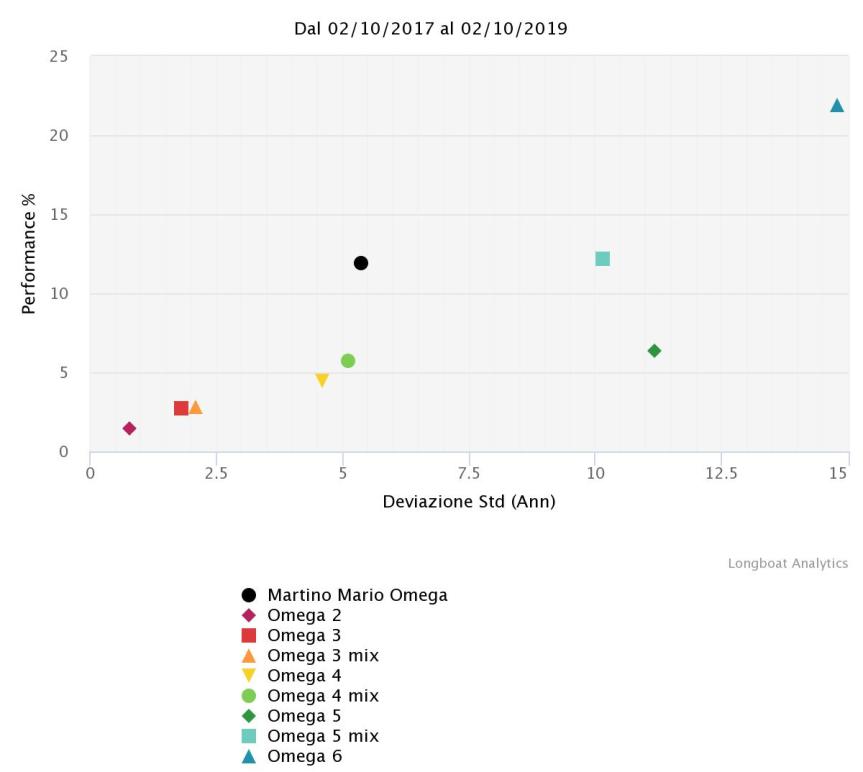
| Analisi Quantitativa Dal 02/10/2017 Al 02/10/2019 – Giornaliero Frequenza – Allineato al Data di Inizio | |||||
| Nome: | Perf. | Perf. Annualizzata | Deviazione Standard Annualizzata | Max Drawdown | Omega |
| Martino Mario Omega | 11,92% | 5,79% | 5,37 | -4,39% | 1,22 |
| Omega 2 | 1,50% | 0,75% | 0,77 | -2,61% | 1,19 |
| Omega 3 | 2,70% | 1,34% | 1,80 | -5,58% | 1,14 |
| Omega 3 mix | 2,81% | 1,40% | 2,09 | -5,67% | 1,12 |
| Omega 4 | 4,47% | 2,21% | 4,60 | -10,40% | 1,09 |
| Omega 4 mix | 5,73% | 2,83% | 5,12 | -9,93% | 1,10 |
| Omega 5 | 6,35% | 3,12% | 11,17 | -20,29% | 1,06 |
| Omega 5 mix | 12,16% | 5,90% | 10,16 | -15,36% | 1,11 |
| Omega 6 | 21,95% | 10,43% | 14,80 | -18,91% | 1,14 |
| Presentato da: Mario Martino | |||||
| Importante: Le performance passate non sono necessariamente un riferimento per le performance future. I prezzi possono salire come scendere.Questi prodotti possono essere influenzati da cambiamenti nei tassi di cambio. Copyright: © Compliance Solutions Strategies 2019 . All Rights Reserved. | |||||
| I valori rappresentati sono basati sulle seguenti ipotesi: Nav to Nav, Utile Lordo, EUR | |||||