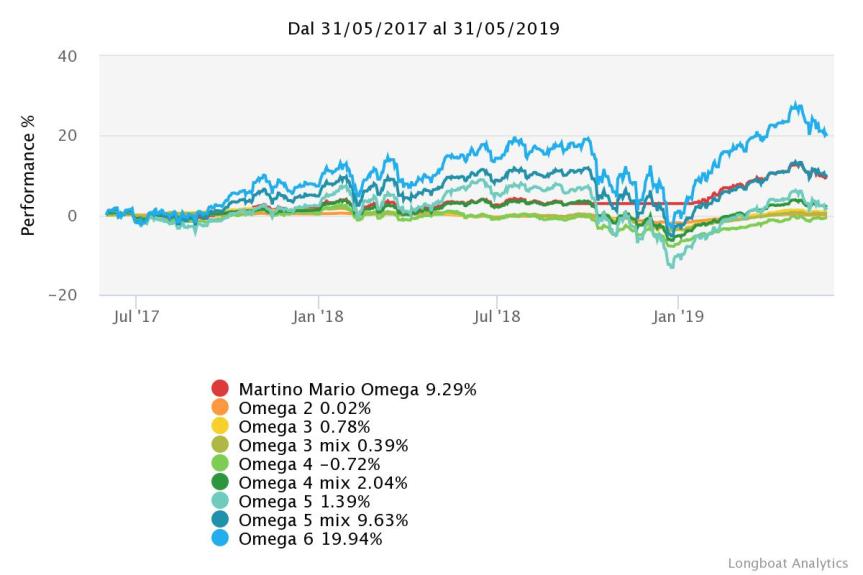
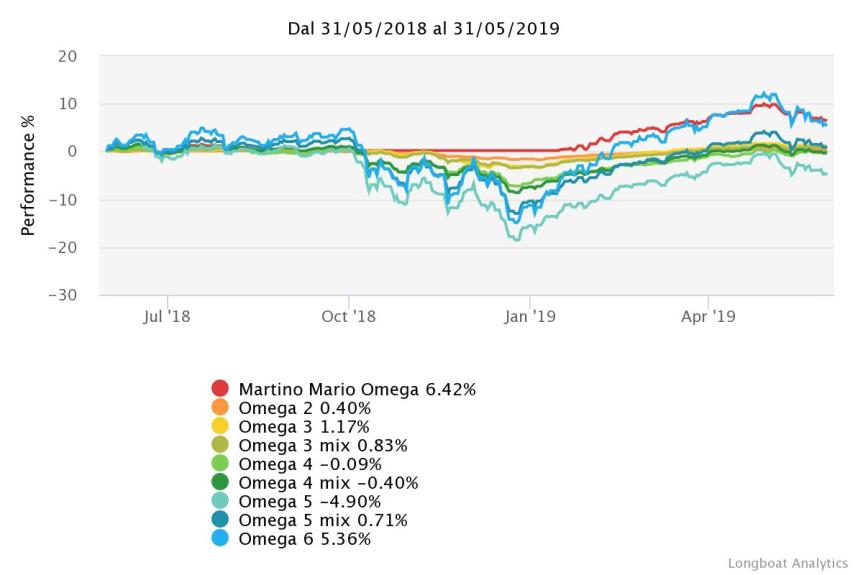
| Analisi Quantitativa Dal 31/05/2016 Al 31/05/2019 – Giornaliero Frequenza – Allineato al Data di Inizio |
|
|
|
|
|
|
| Nome: |
Perf. |
Perf. Annualizzata |
Deviazione Standard Annualizzata |
Max Drawdown |
Omega |
| Martino Mario Omega |
19,01% |
5,97% |
4,52 |
-3,48% |
1,26 |
| Omega 2 |
1,42% |
0,47% |
0,66 |
-2,61% |
1,14 |
| Omega 3 |
3,38% |
1,12% |
1,83 |
-5,58% |
1,11 |
| Omega 3 mix |
3,17% |
1,05% |
2,00 |
-5,67% |
1,10 |
| Omega 4 |
2,90% |
0,96% |
4,78 |
-10,87% |
1,04 |
| Omega 4 mix |
8,64% |
2,80% |
4,78 |
-9,93% |
1,11 |
| Omega 5 |
10,52% |
3,39% |
10,16 |
-20,29% |
1,07 |
| Omega 5 mix |
22,73% |
7,07% |
9,46 |
-15,36% |
1,14 |
| Omega 6 |
44,82% |
13,14% |
12,84 |
-18,91% |
1,19 |
|
|
|
|
|
|
| Presentato da: Mario Martino |
|
|
|
| Importante: Le performance passate non sono necessariamente un riferimento per le performance future. I prezzi possono salire come scendere.Questi prodotti possono essere influenzati da cambiamenti nei tassi di cambio. Copyright: © Compliance Solutions Strategies 2019 . All Rights Reserved. |
| I valori rappresentati sono basati sulle seguenti ipotesi: Nav to Nav, Utile Lordo, EUR |





 Mario Martino