| Analisi Quantitativa Dal 02/06/2016 Al 02/06/2017 – Giornaliero Frequenza – Allineato al Data di Inizio | |||||
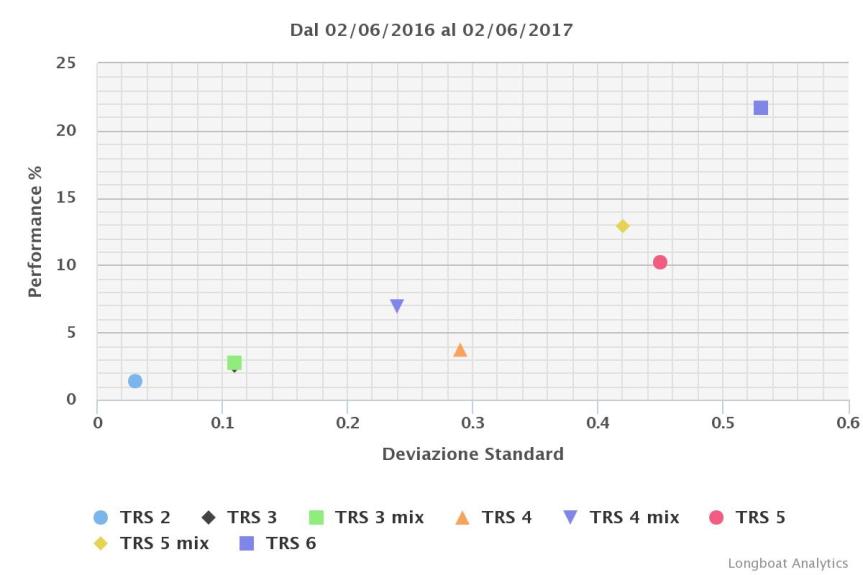
| Nome: | Perf. | Perf Annualizzata | Deviazione Standard Annualizzata | Max Drawdown | Omega |
| TRS 2 | 1,37% | 1,37% | 0,57 | -0,53% | 1,56 |
| TRS 3 | 2,53% | 2,53% | 2,12 | -3,06% | 1,22 |
| TRS 3 mix | 2,74% | 2,74% | 2,18 | -1,57% | 1,22 |
| TRS 4 | 3,72% | 3,72% | 5,59 | -3,70% | 1,12 |
| TRS 4 mix | 6,92% | 6,92% | 4,62 | -2,61% | 1,28 |
| TRS 5 | 10,21% | 10,21% | 8,61 | -4,55% | 1,21 |
| TRS 5 mix | 12,90% | 12,90% | 7,97 | -4,04% | 1,29 |
| TRS 6 | 21,69% | 21,69% | 10,12 | -5,60% | 1,39 |
| Presentato da: Mario Martino | |||||
| Le performance passate non sono necessariamente un riferimento per le performance future. I prezzi possono salire come scendere. Copyrights: © MoneyMate Limited 2017 . All Rights Reserved. MoneyMate® | |||||
 I valori rappresentati sono basati sulle seguenti ipotesi: Nav to Nav, Utile Lordo, EUR I valori rappresentati sono basati sulle seguenti ipotesi: Nav to Nav, Utile Lordo, EUR |
|||||

